Introducing Ekahau Survey 2.0!
- Wi-Fi Team
- Nov 22, 2021
- 3 min read

Survey 2.0 for iOS
We are very excited to bring you the latest update to Ekahau Survey on iOS! In this blog, we will be breaking down what’s new with Ekahau Survey and how it will benefit you, the user. We’ll also go in-depth and show you some examples and use cases of the new features in action. We think you are going to love it!
New look and feel Say hello to the completely renewed look and feel of the Survey app. More than just a pretty face, it also contains significant usability, workflow and content improvements.
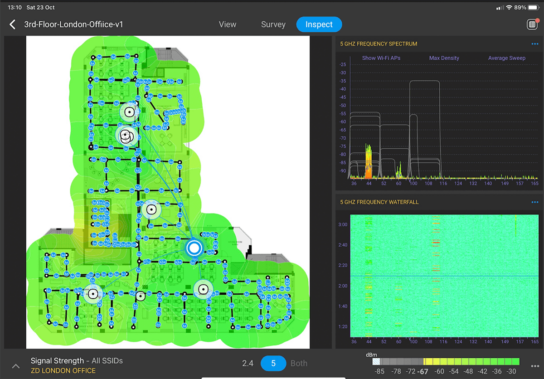
In-depth survey information at your fingertips Introducing a new Inspect view, where you can see and analyze each and every scan point as a playback on your survey path. This allows you to better understand how your Wi-Fi is performing in different locations.
Customize the way you survey and view results Now you can increase the efficiency of your surveying process by telling Sidekick which channels you want to scan. And that’s not all — after the survey, you can also define how the data is presented by controlling various visualization options.
Renewed Usability, Look & Feel
Contrast and clarity of functions
New UI design with better accessibility and contrast:

Usability improvements
Project filtering bar for faster sorting and searching of projects
New, more user-friendly navigation with quick access to band, floor, network and visualization selections
Quick floor renaming/editing functions

More In-Depth Information on Your Surveys at Your Mobile Fingertips
Ensuring successful and accurate data gathering during Wi-Fi site surveys is one of the cornerstones of Ekahau Survey. With Survey 2.0, you can access all the necessary details of your survey paths directly on your mobile devices. The added level of detail lets you validate that you’ve collected what you need the first time without having to waste unnecessary time redoing surveys.
Inspect mode for survey path playback
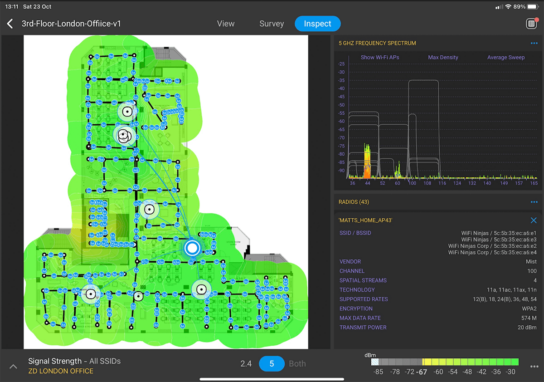
View all scan points and scan details (heard radios and their respective RSSI, SNR and Channel values) on your survey path
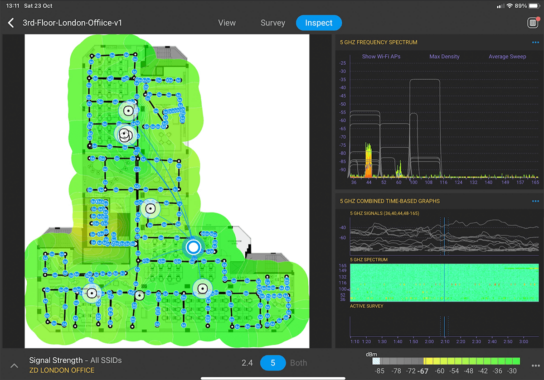
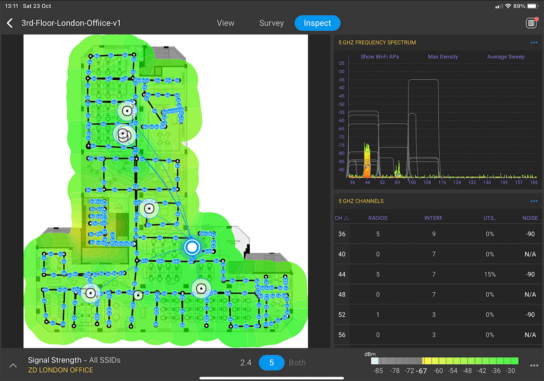
Analyze the spectrum to get a better insight into how busy your RF environment is on each band and channel
Get a better understanding of what issues your survey data might have without the need to open the project in Pro or other tools
Let’s take a quick tour of the new view options available in Inspect mode. Available with Survey 2.0 is a Frequency Waterfall view, Channels view, Combined Time-based graphs, and Radios view:
Customize the Way You Survey and View Results
Performing Wi-Fi scans on all channels can be unnecessary if you are only interested in a specific band or channel. Limiting scans to specific channels also speeds up and increases scan frequency. Now you can customize the channels you want to scan and access new visualization options for the gathered Wi-Fi data.
Sidekick channel selection

Select the Sidekick status icon to define specific channels or channel groups to be scanned with Sidekick. Survey paths with limited scans are marked separately.
Narrowing in on a specific channel or group of channels will help you perform faster surveys. For example, if you are in an environment where there is no requirement for 2.4 GHz — you can deselect the 2.4 GHz channels and just focus on 5 GHz.
Another use case could be if you are in a country with a regulatory domain where some of the 5 GHz channels are not supported (UNII-2e for example). With the ability to deselect those channels from being scanned, you can improve the scan time for the Sidekick.
APoS Surveys (Access Point on a Stick)
With the ability to now select the channels you want the Sidekick to scan, you can focus on just the channels that your APoS AP is using, therefore allowing you to collect more data.
This also allows you to focus on specific channels when you are performing attenuation testing of wall materials on-site, again allowing you to collect more data to enable you to accurately collect the information you need to get your wall/material loss values right the first time.
Less talk, more action! Let us show you some examples now of how you can collect data for your APoS surveys.

Whoa! Check out all those data points! It’s totally freaking awesome (well, we think so anyway) that we can see all of this data now at our mobile fingertips!
Visualization options
Lastly, with Survey 2.0, you can define how you want to view and display your survey findings with multiple additional visualization options like colour schemes and granularity settings.

To learn more about Ekahau Survey 2.0 or to book a demonstration with our team, drop us a message info@yourwifishop.com


Comments